The figures below show the changes in Equivalent Full-Time Student Load (EFTSL) for Indigenous Australian students studying Psychology from 2018 through to 2021. 2021 is the latest year for which official figures are available. Two things should be noted. First, the number of Indigenous students enrolled in psychology programs will be greater than the number of EFTSL because, like most students, they are likely to take less than a full-time load. Very few, if any, students take more than a full-time load. Second, the States differ in the size of their populations and this is true also of the number of Indigenous Australians. While we can compare the percentages of Indigenous and non-Indigenous students, this has some shortcomings as we will describe later.
Figure 1 shows the Pass degree load in EFTSL for Indigenous students by State. (In keeping with previous practice, I have combined the institutions in Tasmania, the Australian Capital Territory, and the Northern Territory.). All States show an increase in load at Pass level over time. While we can assume that this means more Indigenous students are taking Psychology, we should remember that the Pass degree load comprises everyone who is taking subjects/units in Psychology, not necessarily just those who will graduate with a Psychology degree. New South Wales has the largest population of Indigenous Australians and the largest load. Victoria does well, given the size of its Indigenous Australian population.
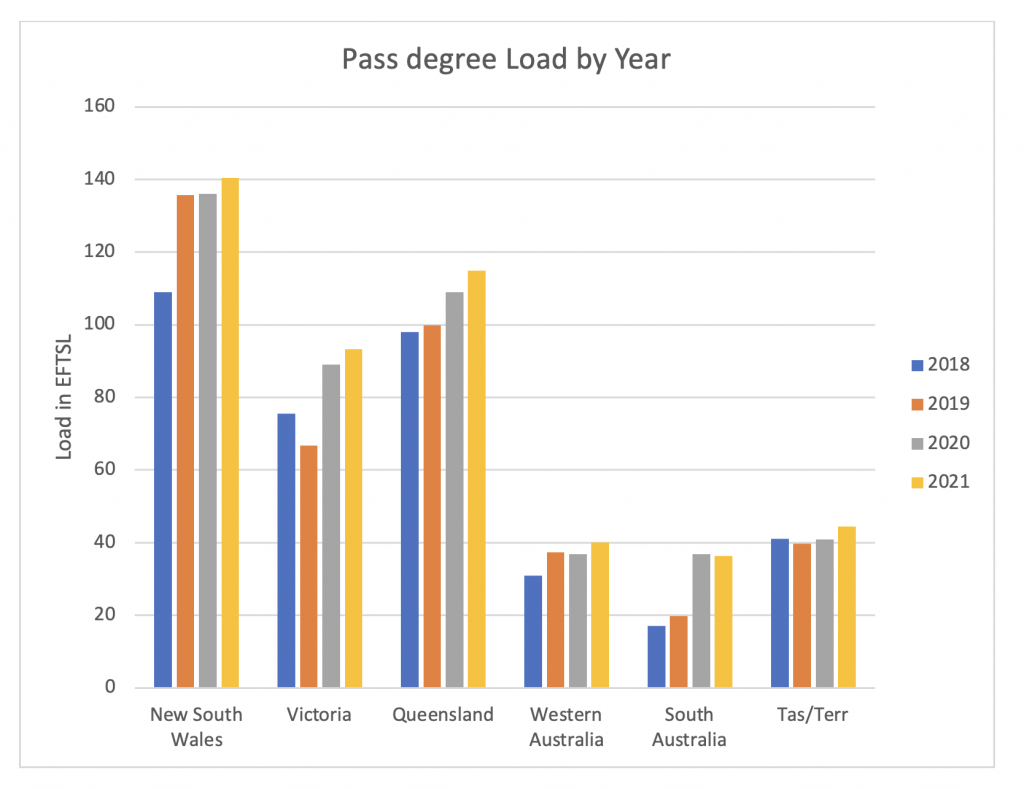
Figure 1: Indigenous student load in Pass degrees by State over the years 2018 to 2021.
Honours load is illustrated in Figure 2[1]. This figure suggests that Queensland outstrips the other States in recruiting Indigenous students into this important degree. However, the Queensland numbers combine Years 1 to 4, if the student is completing a Bachelor in Psychology (Honours) at Griffith University and the University of Queensland. Nevertheless, this load combined with Pass degree load shows that Queensland is recruiting Indigenous Australian students. Both South Australia and Western Australia have very few students in Honours and this probably explains Figures 3 and 4.
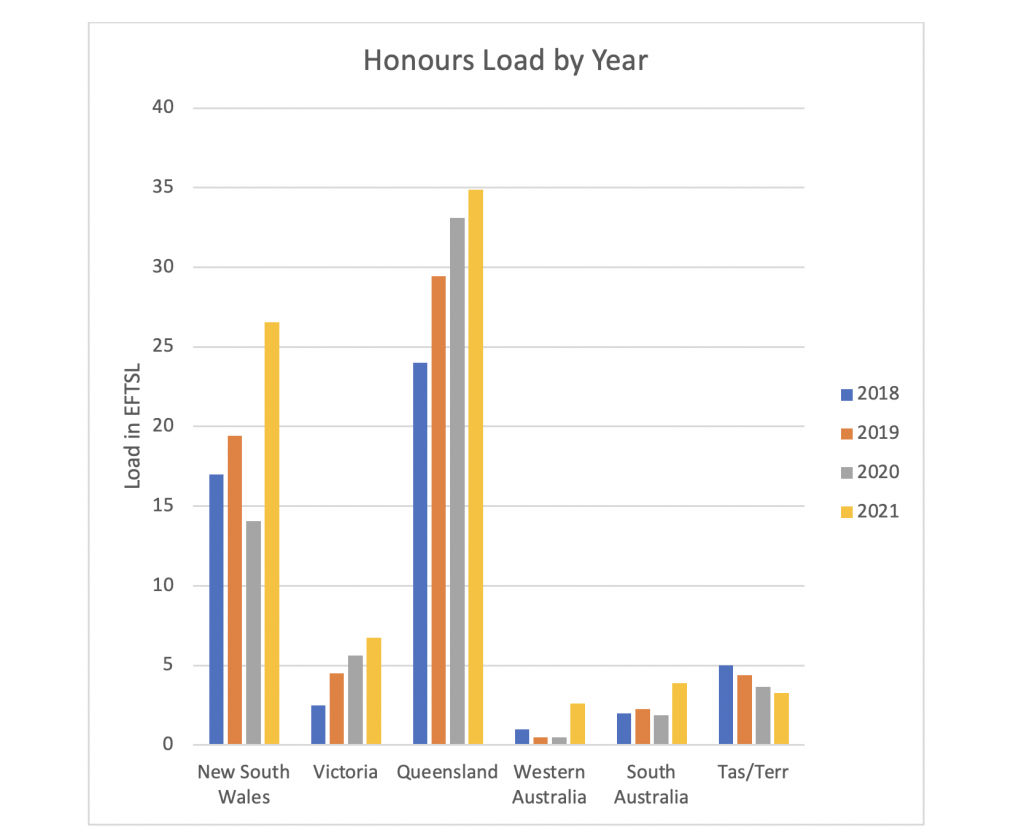
Figure 2: Indigenous student load in Honours degrees by State over the years 2018 to 2021.
Figure 3 shows the Indigenous student load in the Professional Master programs. We cannot discriminate the specialty on the figures provided. However, they are most likely to be enrolled in Master of Clinical Psychology programs, based on what we know about the type and number of Master programs and enrolments. New South Wales and Queensland lead on this measure and are both showing significant increases, consistent with their recruitment into Honours programs. The smaller States appear to be having some difficulty.
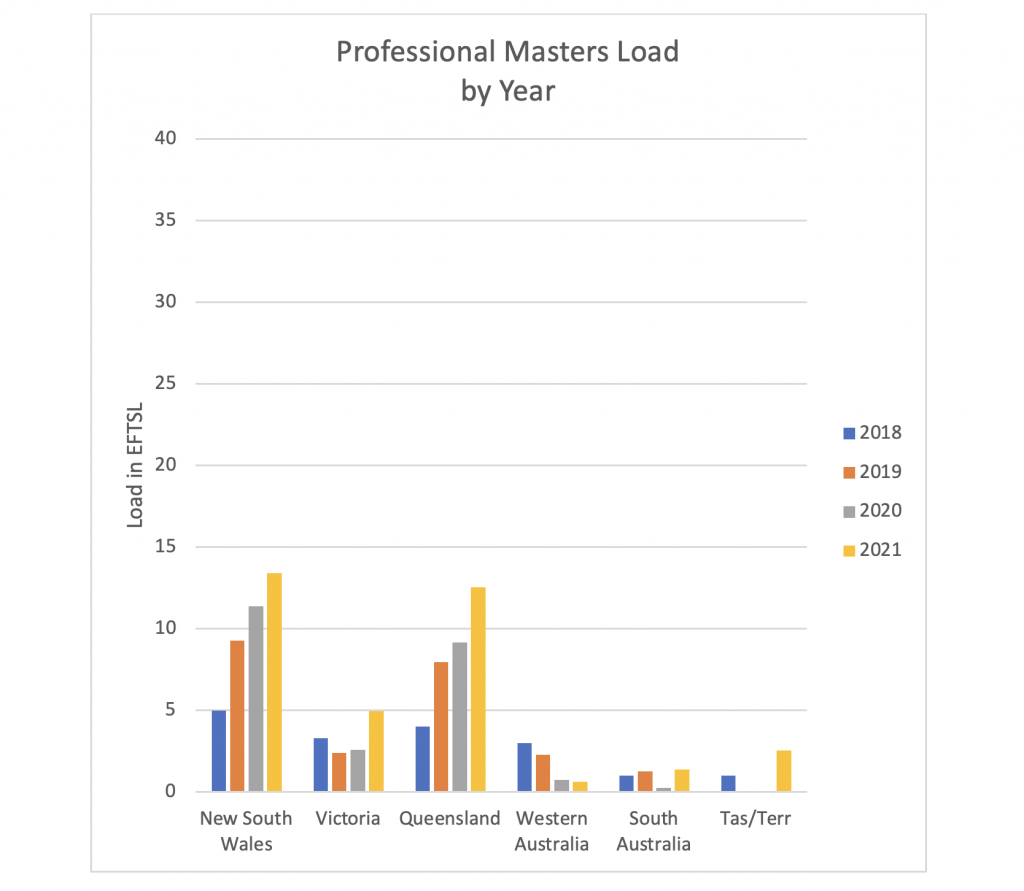
Figure 3: Indigenous student load in Master degrees by State over the years 2018 to 2021. Load in research Doctorates is small, as shown in Figure 4. However, both New South Wales and Victoria are showing good increases in load. This is important because there has been almost no change in load in research Doctorates in non-Indigenous students.
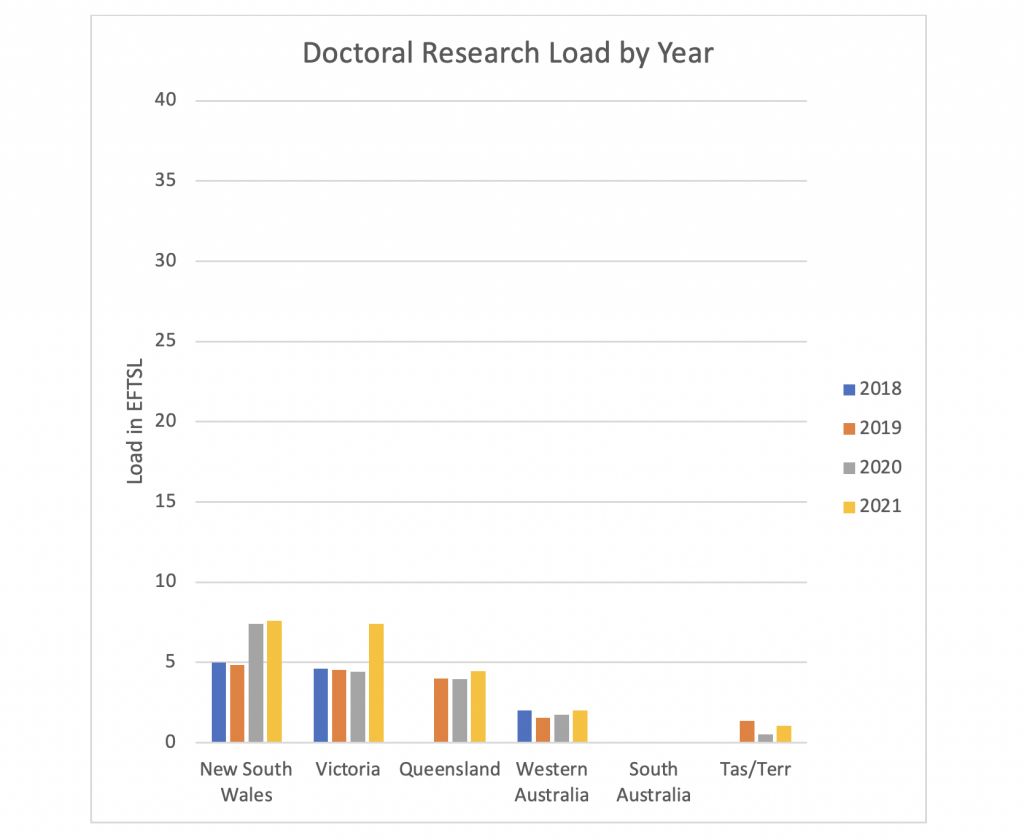
Figure 4: Indigenous student load in Doctoral research degrees by State over the years 2018 to 2021.
The final figure, Figure 5, shows the total load across all programs. All States show some increase across the four years, with New South Wales and Queensland showing the largest load, which is still increasing. Victoria is also doing well, given the size of its Indigenous population.
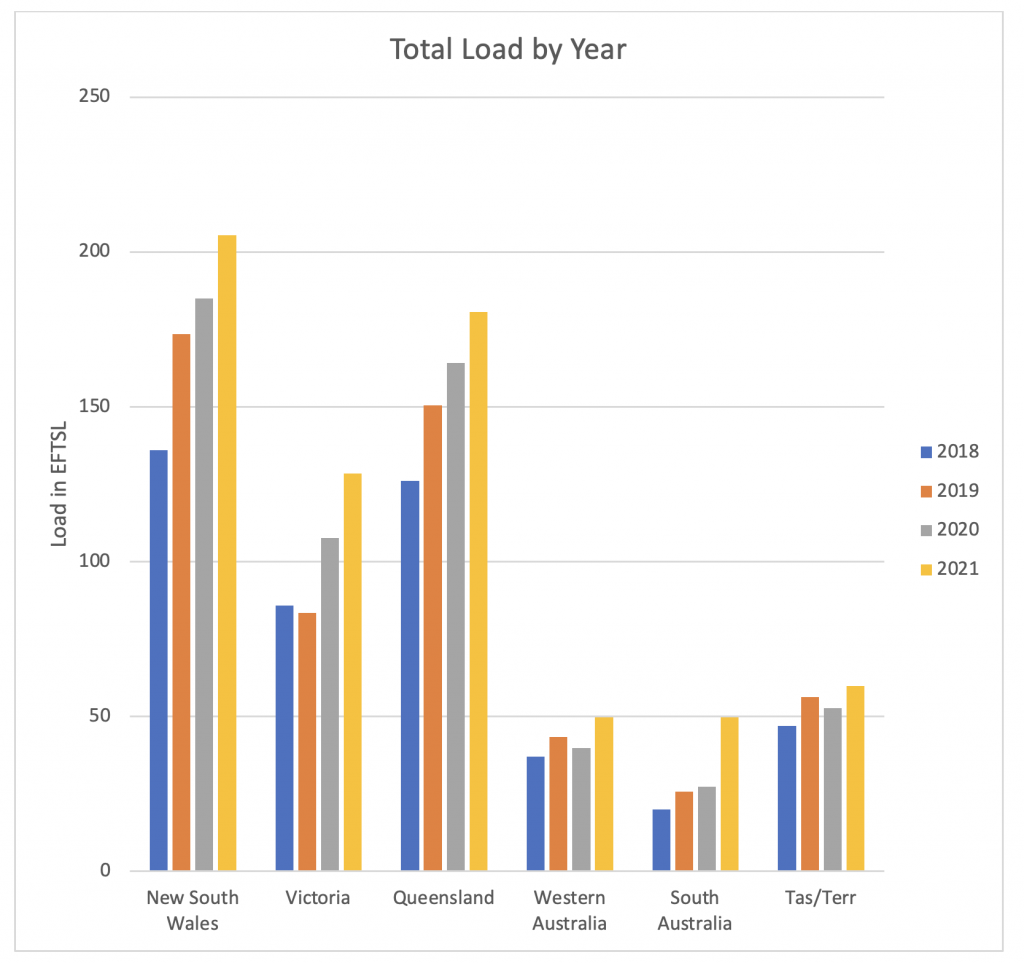
Figure 5: Total Indigenous student load by State over the years 2018 to 2021.
To put these numbers in perspective, Table 1 shows the percentage of the population that is Indigenous for each State and Territory. While some of the differences between States and Territories can be ascribed to the size of the Indigenous Australian population, this is not the only explanation.
Table 1: Indigenous Australians as a Percentage of the overall population by State/Territory
| STATE | Percentage |
| Australian Capital Territory | 2.1 |
| New South Wales | 4.2 |
| Northern Territory | 30.8 |
| Queensland | 5.2 |
| South Australia | 2.9 |
| Tasmania | 6 |
| Victoria | 1.2 |
| Western Australia | 4.4 |
I have also included a Figure looking at the total load of Indigenous Australian students as a percentage of the total domestic load in Psychology. This figure shows that the percentage is increasing, albeit slowly. The increase seems to have slowed in 2021. However, it is worth noting that the total load in psychology grew by 10% in 2021. The fact that Indigenous student load kept pace with this increase indicates that Indigenous load grew by at least 10% in 2021.
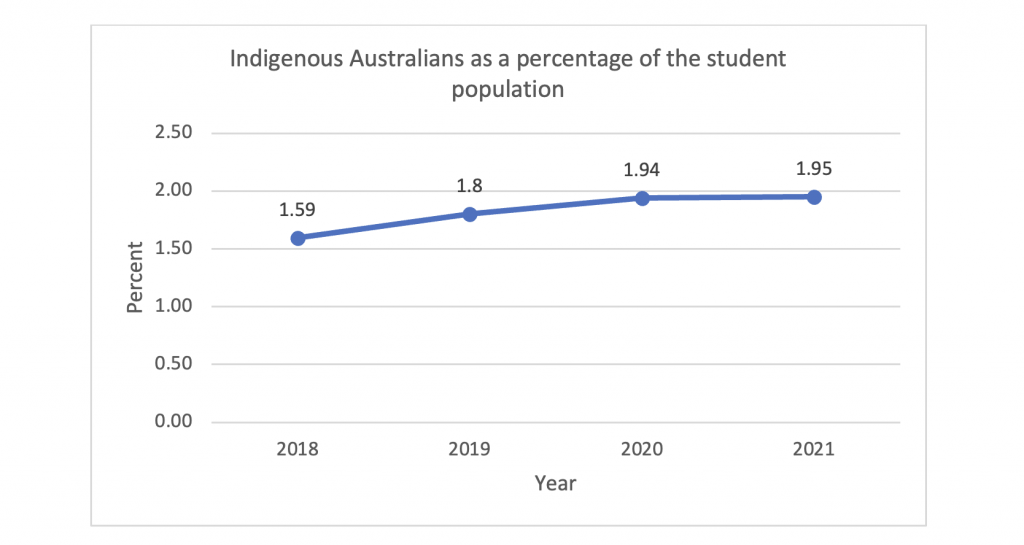
Figure 6: Indigenous student load as a percentage of the total domestic load in Psychology.
Of course, recruitment of Indigenous Australian students is not uniform across institutions. Newcastle University in New South Wales has the highest Indigenous student load, followed by Griffith University in Queensland, and Deakin University in Victoria. Clearly, whatever they are doing is worth copying. I would suggest that South Australia, Western Australia, and Tasmania/Territories focus upon Honours. The conversion rate from Pass to Honours in these States makes it difficult for students to enter the professional and research programs, as illustrated in Figures 3 and 4.
Prepared by Emeritus Professor Nigel Bond, BSc (Hons), PhD, FAPS, FASSA, Executive Officer, HODSPA
[1] Note that Figures 2-4 share the same range for the vertical axis to allow for comparisons.